Multi-Tenant Retail Analytics Platform
One config-driven codebase I wrote and maintained, serving six enterprise grocery and convenience retailers across four countries in three currencies
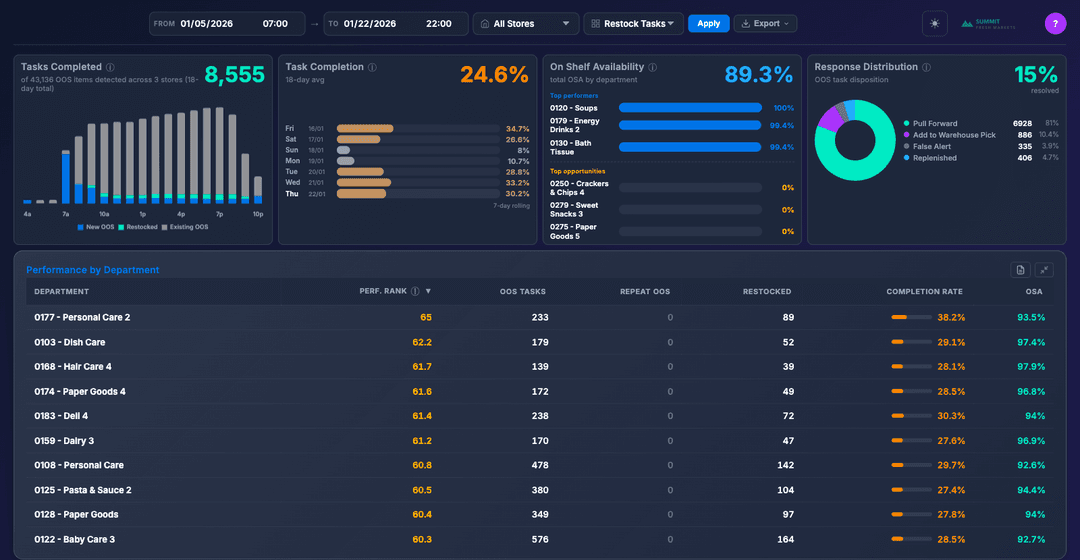
Anonymized demo (fictional retailer, synthetic data): the live KPI surface — tasks, completion, OSA by department, response disposition
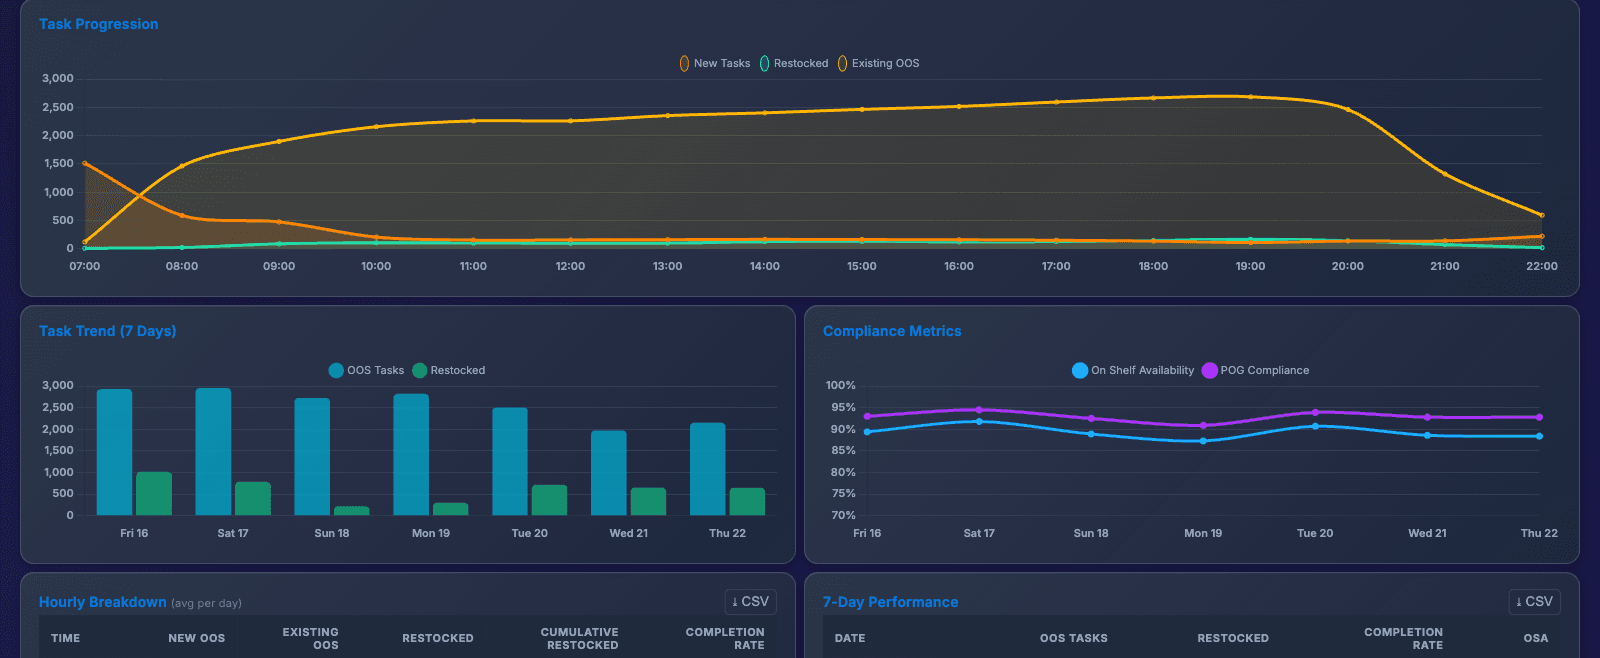
Intraday task progression, 7-day trend, and OSA / planogram-compliance tracking
AI-powered shelf monitoring produced a flood of scan data but not decisions. Store and category leaders couldn't tell what to fix first or how large the addressable opportunity was, and brand-side sponsors funding the programs couldn't see their attributable ROI separately from losses they couldn't influence.
I came at it from the operator seat — time-and-motion observation in pilot stores, and separate conversations with store operators, category leads, and brand-side stakeholders to map what each actually needed from the data. I deliberately grounded the analytics in published academic out-of-stock research rather than vendor benchmarks, so the numbers would hold up under executive scrutiny.
Built the platform end-to-end: one dashboard server whose customer identity, stores, feature flags, data-source model, currency, and task-response taxonomy all come from per-customer YAML config — plus automated weekly exec decks (dashboard API → HTML → screenshot → PPTX) and scheduled PDF report delivery. Led the out-of-stock / lost-sales analytics methodology that turned raw CV scans into prioritized, dollar-quantified actions, and separated the losses store execution can recover from the ones it can't.
- Config-driven tenancy over per-customer forks — onboarding a retailer is a YAML file (stores, feature flags, currency, response-code taxonomy); release branches carry customer-specific deploys of the same codebase
- Two data models behind one dashboard, chosen per customer: a zero-infrastructure real-time API-proxy mode for one pilot's economics, a full scrape→import→rebuild ETL mode for another's, selected by config rather than a rewrite
- A single metric dictionary as the source of truth — every KPI defined once, with a lockstep test so copies of a definition can't drift; that's what made matching the customer's reference reporting system to one decimal possible
- When a customer asked to exclude weekends from a metric, I measured the distortion before changing anything: weekends were 25.8% of the denominator carrying 0.35% of the numerator, and exactly one metric was affected; the fix touched only that one
- One config-driven codebase I wrote and maintained served six enterprise grocery and convenience retailers across four countries in three currencies. Three of the dashboards ran in production; the platform around them was engineering's
- When a customer challenged the numbers in writing, root-caused six KPI defects and shipped a report matching the reference reporting system the customer was validating against, to one decimal across all six departments
- Root-caused a production outage to five distinct mechanisms and cut a >170-second query to 0.64s
- Built an out-of-stock / lost-sales analytics approach that became a reusable internal standard across enterprise grocery pilots
- Made brand-side ROI legible by separating recoverable store-execution losses from non-recoverable supply-chain losses